 One of the major points of friction for a Chief Executive Officer raising growth equity is valuation. CEOs, in their attempt to maximize valuation (and therefore minimize dilution to current shareholders), will often point to the surge of “unicorns” — companies that have soared to a $1 billion valuation — or the stalwarts in their space raising mega-rounds at elevated valuations. Investors, on the other hand, will delve into details of the business (the team, the technology, the pace of growth, and market dynamics, among other factors) to determine a fair price. CEOs may tend to emphasize the qualitative factors, striving to prove they deserve an elevated valuation multiple. Sophisticated investors can be more data driven, using financial analysis to support their projections. Investors seek a targeted cash-on-cash return and are most motivated to invest when the entry valuation is aligned with their expectations.
Entrepreneurs may have heard the adage: “valuation is more art than science.” While there can be certain imprecision behind how an individual investor or firm will assess value, there are a set of components that investors weigh more heavily than others. They can be grouped into broad quantifiable and non-quantifiable categories:
Hard numbers drive many investors’ valuation methodologies. All financial valuation stems from one fundamental concept: summing future cash flows to compute present value. The difficulty lies in accurately projecting these cash flows, especially for a fledgling business. And cash flow for software companies in the growth stage is a lagging indicator — they often spend all their profits to secure market share and establish top-line growth. Once sales are strong enough to cover the cost of new customer acquisition, true free cash flow generation begins. So while a software company may have no EBITDA, revenue is viewed as a proxy for potential profits. Salil Deshpande, a managing director at Bain Capital Ventures, describes the chronology of multiples used over time as companies expect more aggressive valuations: “Companies used to trade on EBITDA. Then that changed to companies trading on a multiple of sales. Then that changed to forward sales. Now it’s a multiple on the annual recurring revenue. Now people are going and saying, don’t look at our annual recurring revenue, look at what our year-ending annual recurring revenue will be.”
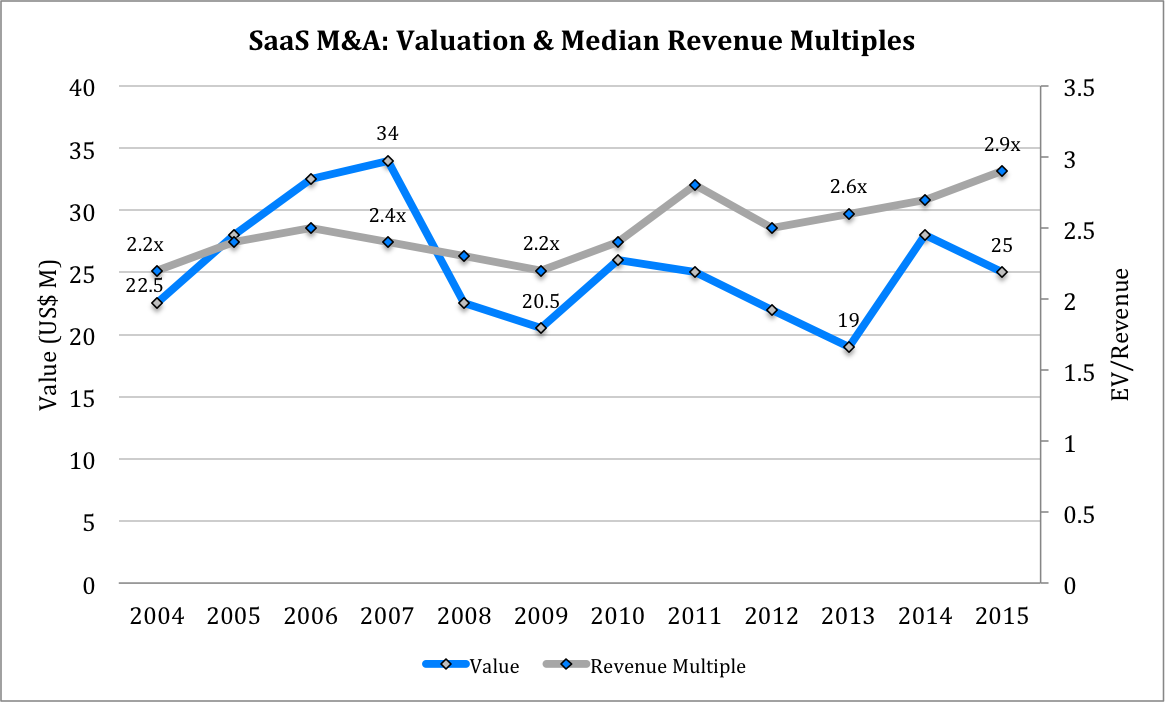
MandAsoft, a mergers and acquisitions data repository based on Berkery Noyes’ Information Industry Weekly, analyzed thousands of mergers in the software industry from 2004 to 2014. The revenue multiple for software companies has been steadily rising over the past decade to a median of 2.9. It is important to note that valuation multiples in merger transactions are typically higher than in growth equity deals due to the acquirer gaining full control of the target (hence, a control premium is paid) and the synergies it expects from the business combination (revenue and/or cost synergies).
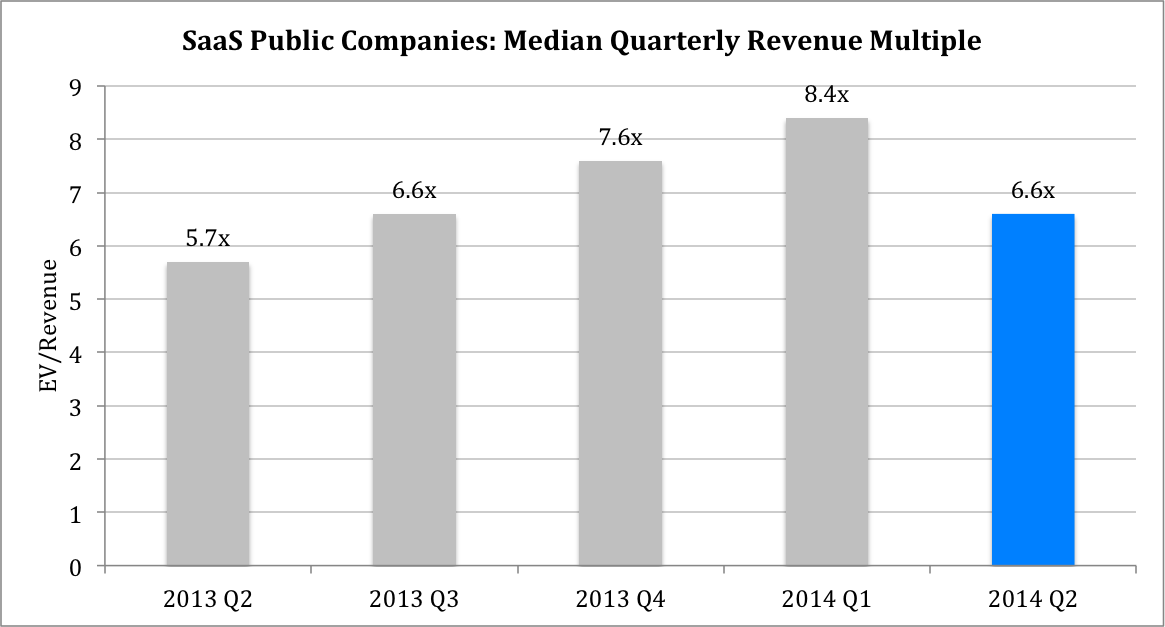
Publicly listed companies have historically enjoyed larger multiples than private companies. Recently, however, enterprise software public multiples have experienced a mean reversion, while private valuations have never been higher.
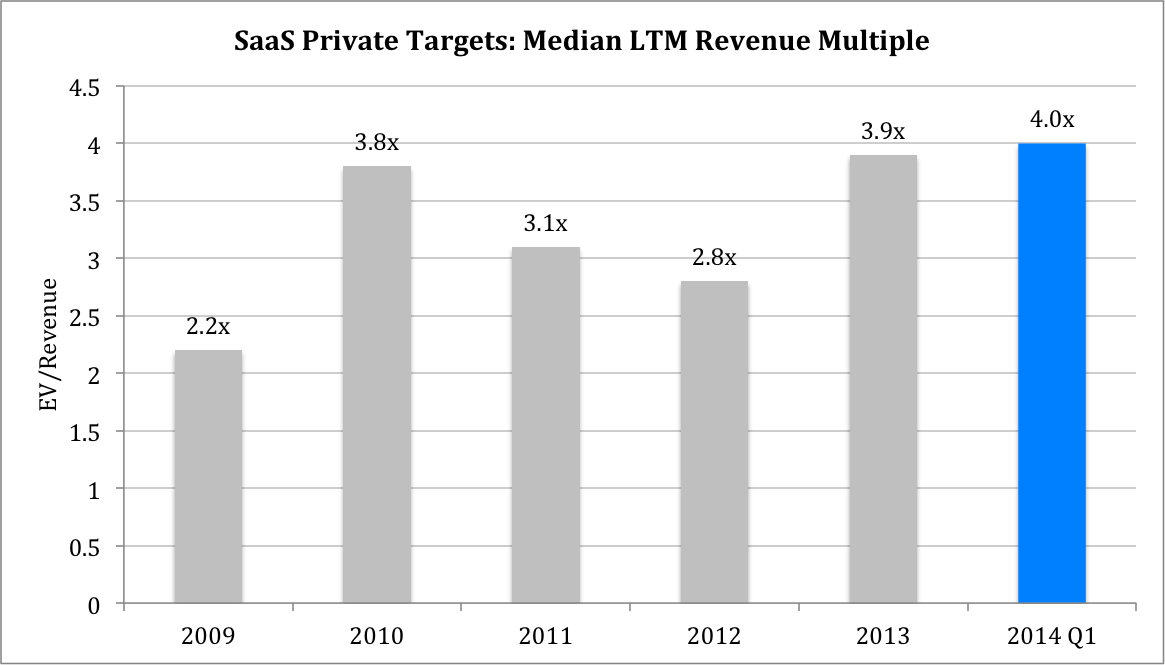
Private company revenue multiples have been steadily rising, from 2.8x in 2012 to 4.0x in Q1 2014. Meanwhile, public company multiples have undergone a significant compression. Tomasz Tunguz, a partner at Redpoint Ventures, underscores this consolidation among public SaaS companies, highlighting how “today, there are fewer and fewer outliers, companies trading at heady multiples, compared to 2014… they now trade within a much narrower band.” Public multiples fell drastically to 6.6x in Q2 2014 after a steady rise from Q3 2013. And Tonguz concludes, “the compression hasn’t impacted valuations in early venture rounds. Companies are growing faster than ever, a very enticing attribute for investors and higher growth rates command premiums.”
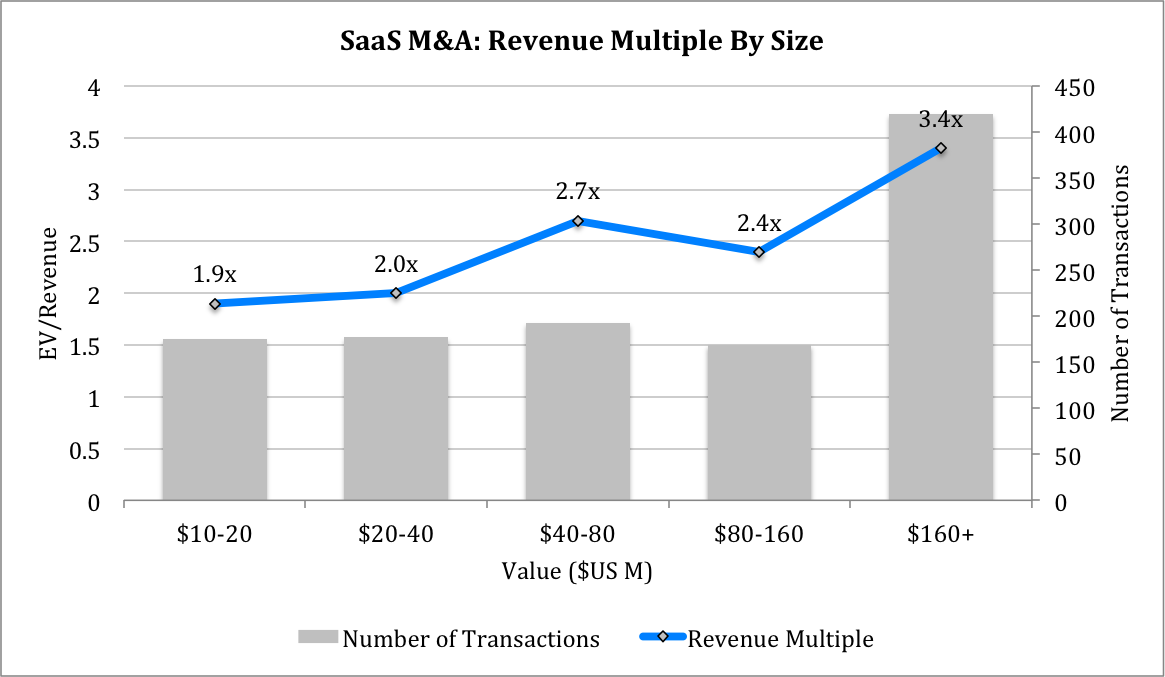
Investors also pay a size premium, forgoing growth potential for stability as the chart below illustrates. This premium for larger companies is even more pronounced with top public performers such as Cornerstone OnDemand, Demandware, FireEye, NetSuite, Palo Alto Networks, ServiceNow, Splunk, and Workday, trading at an average of 8x revenue as of Q1 2015.
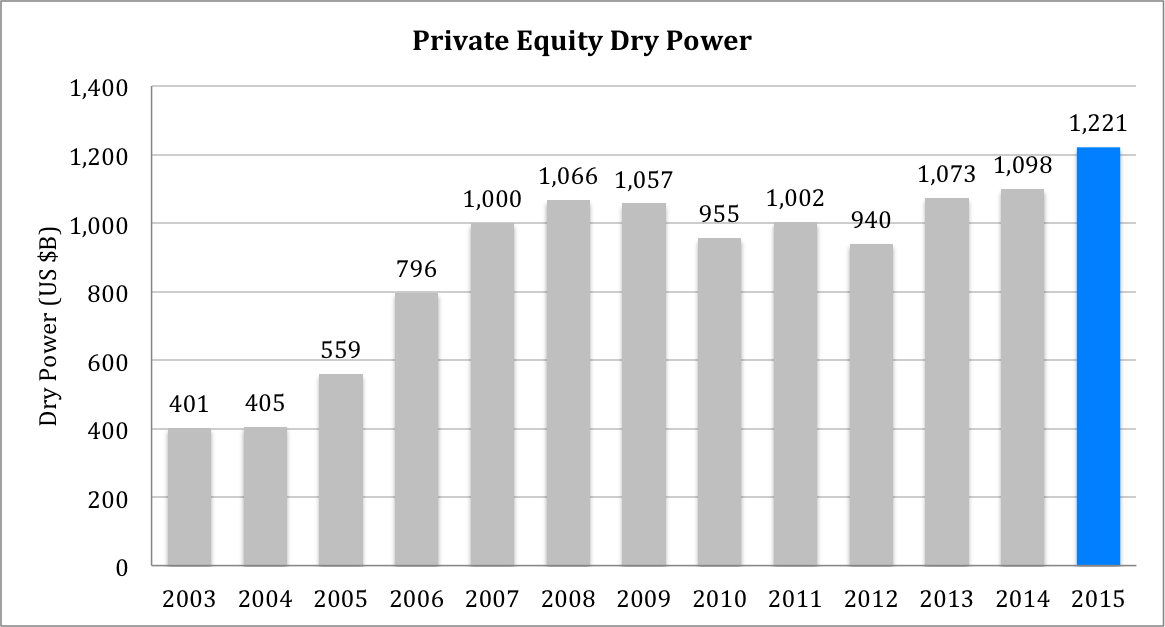
An increase in the amount of money allocated to invest in private companies leads to increasing competition and prices paid for businesses, which ultimately leads to lower returns. The amount of capital allocated to the private markets has increased substantially in the past decade as more institutional money has been shifting away from public markets and pouring into venture capital and growth equity strategies. Total private equity dry powder, or the amount available to actively invest, topped $1.2 trillion in March 2015, a 14% increase from December. Total uncalled capital commitments have more than tripled over the past twelve years.
Many software companies benefit from successfully implementing recurring revenue business models despite the initial net negative cash flow that results from foregoing large up-front payments in exchange for smaller, contracted recurring payments. As software companies have shifted to the more stable and predictable SaaS delivery and pricing models, investors have rewarded them with more growth capital at full market valuations. In short, investors will pay a premium for companies that demonstrate loyal customer bases with low concentration and limited churn. Furthermore, companies that have achieved some level of scale have proven they are capable of marketing their products and supporting a customer base over a long period of time, thus reducing the execution risk inherent in most growth-stage companies. An existing subscriber base provides confidence in future revenue projections while mitigating the risks associated with recreating a core revenue base.
Top-line figures alone do not convey sufficient information about growth and potential of a business. To address these issues, investors consider a company’s Total Addressable Market (TAM). Investors, despite having more tempered expectations than business-owners, strive to sink their teeth in companies that operate in billion-dollar markets with juicy penetration opportunities. For example, out of the 39 unicorns founded since 2003, 17 provide enterprise oriented software solutions. Still, a large market is irrelevant if the product or service has a low adoptability rate due to high switching costs or inferior quality. Executives not only have to be aware of absolute number of potential end buyers, but also of their level of readiness for a new solution and a foreseeable strategy with which you can reach and convert them to loyal customers.
To ultimately realize returns and exit the position, investors search for companies with prolific top-line growth rates. Growth decay is faster among non-mature companies — most growth-stage companies cannot consistently triple their revenue year after year. Andy Vitus, a partner at Scale Venture Partners, uses the concept of growth decay to build a valuation framework for recurring revenue companies. (Growth decay is the company’s current year growth rate compared to its previous year growth rate. For example, a growth decay of 10% means that a company that grew 100% last year is expected to grow 90% this year).
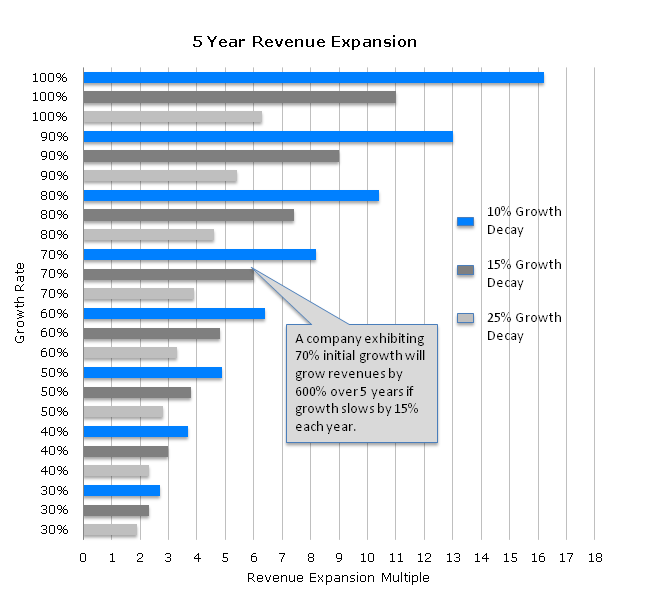
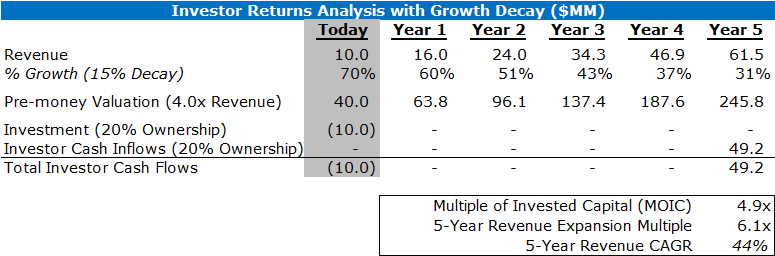
Scale VP’s analysis shows that even top performers in their industry will see growth decline by at least 10% per year with most companies experiencing decay of 15% to 25% per year. For example, a company growing 70% today with 15% decay will expand revenue by 6x within 5 years. We’ve also included below a detailed example of how growth can determine valuation levels. In the example, we assume 1) a minority investment for 20% ownership, 2) a constant valuation multiple (which most investors would argue is inaccurate given a company whose growth has declined by 50% would warrant a lower multiple of sales upon selling the business), and 3) that a growth investor is looking for a return of 5x in an upside scenario. You can see that in order for an investor to get their desired return, a company that is growing by at least 70% per year at the time of investment would be valued at 4.0x revenue. Growth companies are not operating at optimum profitability levels because they are pouring capital to capture market share — if their efforts are not reflected in top-line growth, investors will detract value.
Businesses cannot be fully explained by spreadsheet calculations and financial models. To understand the complete picture, investors must also evaluate other inherent strengths and weaknesses of an opportunity.
A qualified management team commands added value. Investors feel comfortable trusting executives with histories of past success and proven business acumen. A CEO who has grown a previous business in a similar industry will not underestimate the hurdles to achieving success. Executives who have experience maneuvering the market will be able to adjust the company’s direction if new entrants or regulation unexpectedly alter the industry landscape. A seasoned team will have access to a stronger network, making it easier to forge valuable partnerships and recruit capable employees. While past success is no guarantee of future performance, a solid management team will often be a key factor in how investors value a company and its potential.
Occupying a unique competitive position in an industry and building a “moat” around the business helps companies protect their market share while mitigating the risk of sudden disruptive competitive forces. Investors also gauge the company’s ability to rapidly scale because it can attract customers in ways that others cannot. These competitive advantages usually come from strong research and development, exclusive distribution channels, or superior customer support. And as mentioned above, investors find it harder to pass up opportunities where companies can make fast inroads into large, untapped spaces.
A common source of competitive advantage in the software industry is innovative technologies. Sometimes, technology can be so new that it hasn’t received broad industry acceptance, or is yet to reach the monetization stage. Investors can ascribe value to a fledgling technology as long as there is a clear pathway to monetization and no threat of replacement in the near term.
Valuation disparities among CEOs and investors are a common part of the transaction process and at times can lead to an impasse in deal talks. However, if both sides can better understand each others perspective and use a logical framework to base negotiations on, there is a higher likelihood of reaching agreement. Finding fair valuation will be more challenging and time-consuming in an overly bullish or bearish financial climate. In these situations, understanding the core drivers behind valuation is even more critical.
Discover unique insights from growth investors and leading executives.
Sign up for our weekly newsletter.
